
Most Ohio sheriff sale investors watch the same two or three counties every week. Cuyahoga. Franklin. Maybe Hamilton. And they miss it when a county they've never looked at suddenly posts a week of real deals.
That's what happened with Lucas County. It went from two listings at zero discount to 12 listings at 38% off appraised value, with an 83% sale rate and a $110,000 average price. If you're trying to figure out how to evaluate a new sheriff sale market in Ohio, that week is worth studying. The investors who caught it had a process for spotting the signal and deciding whether to act. Everyone else was still refreshing the same Cuyahoga page they check every Monday.
This guide covers that process: how to spot a breakout county in your County Recap data, screen its listings with Deal Scoring, and figure out whether it belongs on your watchlist or was just a weird week.
What a breakout week actually looks like
A breakout week isn't just "more listings." Counties spike in volume all the time and produce nothing worth bidding on. What made Lucas County different is that three things happened at once.
The volume jumped. Lucas had been averaging two listings per week for months. Then it posted 12. A 6x jump. That means the county's filing pipeline (the foreclosure cases working through court) finally caught up to auction day.
The discounts were real. Those 12 listings came in at an average 38% discount to appraised value. The prior week? Zero percent. On a $110,000 average property, 38% off translates to roughly $41,800 in gross spread per deal (the gap between what you'd pay at auction and the appraised value). That's room to work with on a flip, a rental acquisition, or a wholesale assignment.
And people actually bought them. This is what separates a breakout from a dump. If properties are listed at steep discounts but nobody bids, the market is telling you something is wrong (bad locations, title problems, condition issues nobody wants to touch). Lucas posted an 83% sale rate. Ten of 12 sold. Investors showed up.
When volume, discounts, and sale rate all spike in the same week, pay attention.
(If you're not familiar with the term: "gross spread" is the difference between the auction price and the appraised value. Not profit. You still have closing costs, renovation, holding costs, and your exit strategy eating into that number. But it tells you whether there's room to work with.)
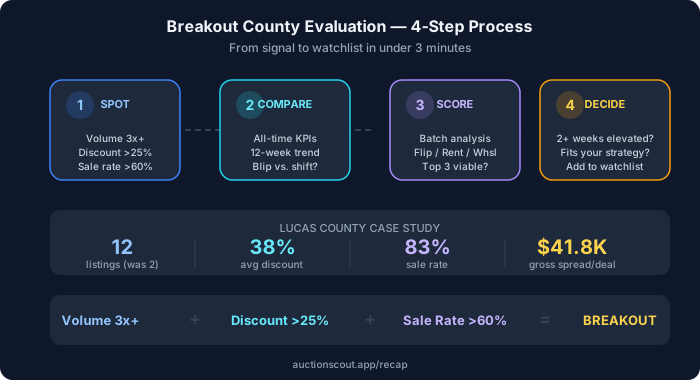
Step 1: Spot the signal in County Recap
Every Ohio county has a recap page on AuctionScout (auctionscout.app/recap) that updates weekly with auction results. Each page shows listings, sold count, sale rate, average price, and average discount, plus a 12-week trend chart.
You don't need to check all 88 counties manually. When scanning the recap dashboard, three filters will catch most breakouts:
Look for volume jumps where this week's listing count is 3x or more above the recent average. A county going from three to four isn't a signal. Two to 12 is.
Look for average discounts above 25%. That's your fastest filter for real investor margin. Below 15%, the math gets tight for most strategies. Above 25%, flips, rentals, and wholesale deals can all work. Above 35%, there's breathing room even if renovation costs run over.
And look for sale rates above 60%. A high sale rate means other investors looked at these properties and decided they were worth bidding on. If volume and discounts spike but sale rate drops below 50%, be more cautious. The deals might look good on paper but have issues that experienced local bidders can see and you can't (yet).
The combination matters more than any single number. Volume alone is noise. Discounts alone might mean distressed properties nobody wants. Sale rate alone tells you nothing about margin. You want at least two of the three spiking, ideally all three.
Step 2: Compare to all-time KPIs
One good week doesn't make a market. Before you dig into individual properties, check whether the breakout is a blip or part of something building.
Every county recap page shows all-time KPIs alongside the weekly numbers. These tell you what "normal" looks like for that county, which is the context you need to judge whether a single week means anything.
Compare this week's discount to the all-time average. If Lucas County's all-time average discount is 15% and it just posted 38%, that's a big deviation. Could mean the county is entering a new phase of inventory quality. Could be a one-week outlier. Either way, it's unusual, and unusual is what you're screening for.
Pull up the 12-week trend chart and look at volume. Is it gradually climbing (say, 2, 3, 4, 7, 12), or did it jump from flat (2, 2, 2, 2, 12)? A gradual build suggests the filing pipeline is growing and you'll see more inventory going forward. A single spike from a flat line might be a batch of cases that all resolved in the same week. Still worth looking at, but less predictive of what comes next.
Check whether the sale rate has been trending up. A rising sale rate over several weeks means more bidders are showing up. That's a mixed signal: more competition, but also confirmation that the deals are legit.
For Lucas County specifically, the breakout came after months of micro-volume. The 12-week trend is basically a flat line followed by a spike. That's a pattern you watch closely but don't overcommit to. You'd want to see two or three more weeks of elevated volume before shifting real resources there.
It also helps to compare the breakout county to counties you already know. If you're active in Cuyahoga (which recently posted 75 listings at 40% discount and $66,800 average), Lucas at 12 listings and $110,000 average is a completely different profile. Fewer deals, higher price points. That might suit different strategies or different investors. Summit County, meanwhile, posted eight listings at 44% discount on $114,700 averages. Every county has its own shape.
Step 3: Run Deal Scoring on the breakout county's listings
Once the county-level signal checks out, look at individual properties. This is where you find out whether the aggregate numbers hold up at the property level or if a couple of outliers are skewing everything.
Deal Scoring in AuctionScout rates each listed property across three strategies: flip, long-term rental, and short-term rental. It pulls comparable sales and multiple retail value estimates, then combines that with renovation estimates to project ROI for each approach.
When you're evaluating a county for the first time, run batch analysis on everything. Don't cherry-pick. You want the full picture. If 8 of 12 listings score well for flips, that tells you something different than a county where one property is carrying the averages and the rest are duds.
Pay attention to which strategies score highest across the batch. Some counties lean heavily toward one investor type. Low-price, high-discount counties (Cuyahoga at $67,000 averages) tend to produce more wholesale and rental opportunities. Higher-price counties with moderate discounts might favor flips. This is the county's "personality," and it tells you whether the market fits how you actually invest.
In a county you don't know, renovation costs are your biggest blind spot. AuctionScout's renovation estimator (line-item, template, or AI-generated) gives you a starting point, but be skeptical in unfamiliar markets. A full gut rehab in Toledo and a full gut rehab in Columbus are not the same number, even on similar-sized properties.
Sort by your preferred strategy's score and look at the top three deals. If those three have projected returns strong enough that you'd actually drive by the properties and pull the case docket, the county passes. If even the top deals look marginal, the county-level stats might be misleading.
The whole point of this step is speed. You're not making a buying decision. You're answering one question: does this county have deals worth my deeper research time?
Step 4: Decide whether to add it to your watchlist
You've spotted the signal, checked it against historical KPIs, and screened the individual listings. Now the actual decision: one-week anomaly, or does this county earn a permanent spot on your radar?
Four things to check:
Did volume stay elevated for two or more consecutive weeks? One big week can be a batch of cases resolving at the same time. Two consecutive above-average weeks suggests the filing pipeline has genuinely grown. If you're evaluating in real time and it's still week one, set a Smart Alert and check back.
Is the sale rate holding above 60%? Sustained participation from bidders means the deals are surviving scrutiny from people who actually show up with deposit checks. If sale rate drops sharply in the second week despite strong volume and discounts, local bidders may know something you don't.
Are discounts consistently above the county's all-time average? A single week of 38% followed by a return to 5% means you caught a lucky batch, not a trend. If discounts hold in the 20%+ range over several weeks, the county's inventory quality has actually shifted.
Do the Deal Scoring results match your strategy? A county can have great aggregate stats but not produce deals that fit how you invest. If you flip houses and the county keeps scoring high for rentals but low for flips, it might not be your market, even with strong headline numbers.
If a county clears three or four of these, add it to your active monitoring list. Set up Smart Alerts for your criteria (price range, property type, minimum discount) and check the County Recap page weekly. You've just widened your deal flow without adding much work.
If it fails? Don't write it off entirely. Set a reminder to revisit in four to six weeks. Filing pipelines shift. Today's micro-volume county could be next month's breakout.
The counties most likely to break out next
Every breakout follows the same pattern: a county's foreclosure filing pipeline grows, cases work through court over months, and then a batch of properties hit the auction calendar at once.
We watch a few signals for counties that haven't broken out yet.
Rising filing counts with flat auction volume. If court filings are increasing but weekly auction listings haven't budged, those filings are still working through the system. When they arrive, volume spikes.
Counties next to hot markets. When Cuyahoga or Franklin get competitive (more bidders, tighter margins), investors start looking next door. Montgomery County, Stark County, and Butler County are all within the orbit of bigger metro areas and tend to see spillover when their neighbors get crowded.
Small counties with improving sale rates. A county posting a 75% sale rate on four listings is building a quiet track record. If volume picks up there, the fundamentals suggest deals will be competitive from day one.
We track all 88 Ohio counties. The recap pages let you compare any county's trajectory without building your own spreadsheets.
Common mistakes when evaluating new counties
Chasing a single week. We've seen investors get excited about a county after one strong week, start driving properties, and then watch the next three weeks go back to two listings at no discount. One week is interesting. Let it breathe before you commit time.
Porting renovation costs from one market to another. What costs $25,000 to renovate in Toledo might run $40,000 in Columbus. Labor rates, material availability, contractor density, all of it differs by market. If you've only ever rehabbed in one county, your gut numbers are probably wrong for the new one.
Skipping the title check. Especially in a county you're new to, liens matter. Property tax liens and special assessments survive sheriff sales in Ohio. IRS federal tax liens survive too, and the IRS gets a 120-day right to redeem (they can buy the property from you at the price you paid within that window). Junior liens are only extinguished if the holders were properly served in the foreclosure action. Always pull the case docket.
Confusing appraised value with after-repair value. The discount percentages in County Recap are based on appraised value, which is not what the property will be worth after renovation. A 38% discount on a $110,000 appraisal is a starting point, not a guarantee. Run the numbers through Deal Scoring or your own analysis.
Forgetting that deposits are statutory. Ohio sheriff sale deposits aren't a percentage of the sale price. They're flat dollar amounts set by statute: $2,000 for properties appraised at $10,000 or less, $5,000 for $10,001 to $200,000, and $10,000 above $200,000. Franklin County is the exception, where the plaintiff's attorney sets the deposit at their discretion. Budget for the right tier.
FAQ
How often does AuctionScout update county data? Weekly. Each county recap page shows the most recent week's results plus a 12-week trend chart.
Do I need a paid plan to see County Recap data? The basics (listings, sold, sale rate, average price, average discount) are free. Deal Scoring, AI-powered valuation, and batch analysis require Pro ($49/mo) or Team ($149/mo). Both have a 14-day free trial, no credit card required.
What counts as a "good" sale rate for a breakout county? Above 60% means bidders are showing up. Above 75% is strong. Below 50%, be cautious. Could be title issues, condition problems, or pricing that doesn't work for experienced bidders. Always compare to the county's all-time average.
How many weeks should I watch before investing in a new county? Depends on your risk tolerance. Two to three weeks of sustained elevated volume and decent discounts is where most investors we talk to start feeling comfortable. One week just means "keep watching."
Can I set alerts for breakout counties? Yes. Smart Alerts let you set criteria (county, price range, property type, minimum discount) and get notified when matching properties hit the auction calendar. Set one and let the data come to you.
Check your county recaps
See which Ohio counties are heating up this week at auctionscout.app/recap. Or try AuctionScout free for 14 days and run Deal Scoring on any county that catches your eye. Takes 30 seconds to set up.
For the Lucas County data referenced in this guide: Lucas County recap page.